- Published on
Spotting and Avoiding Heap Fragmentation in Rust Applications
- Authors

- Name
- Owen Nelson
- @theomn
Mystery of the Stair-step profile.
We recently saw one of our Rust projects, an axum service, exhibit some odd behavior when it came to memory usage. An odd-looking memory profile is the last thing I’d expect from a Rust program, but here we are.
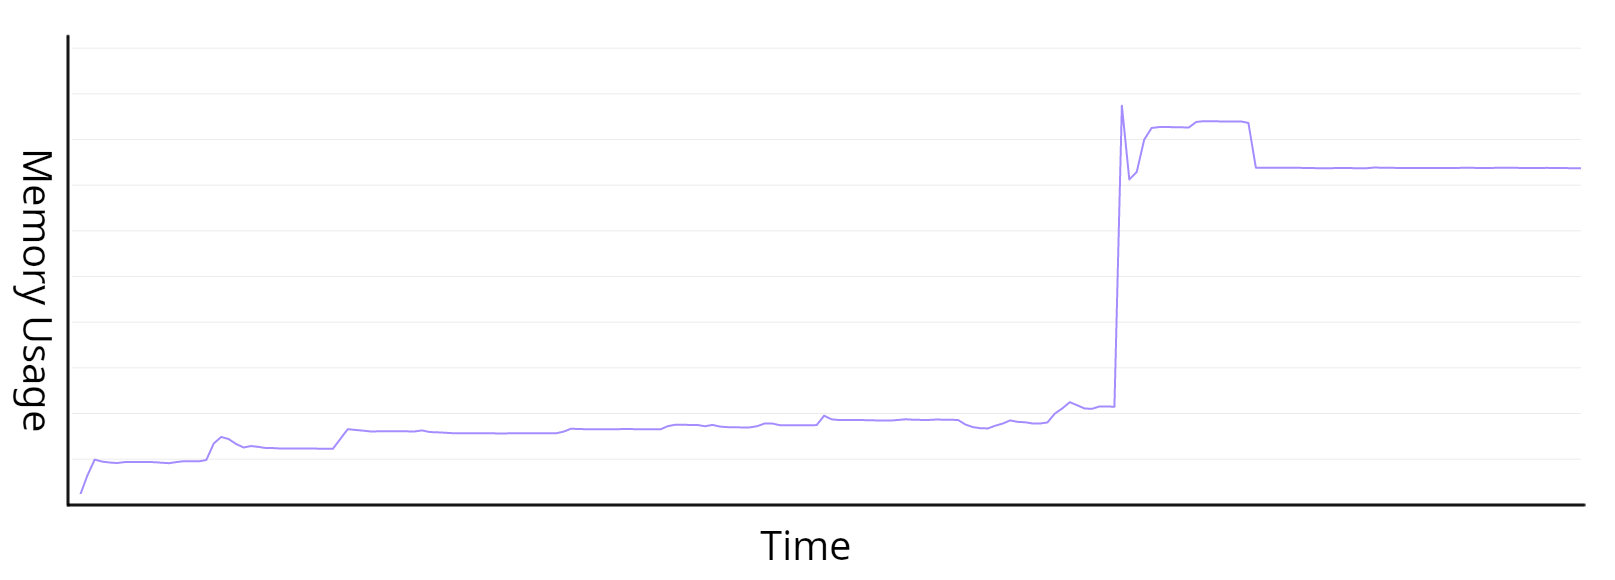
The service would run with "flat" memory for a period of time, then suddenly jump up to a new plateau. This pattern would repeat over hours, sometimes under load, but not always. The worrying part was once we saw a sharp increase, it was rare for the memory to drop back down. It was as if the memory was lost, or otherwise "leaked" once in a while.
Under normal circumstances, this "stair-step" profile was just odd looking, but at one point the memory usage climbed disproportionately. Unbounded memory growth can lead to services being forced to exit. When services exit abruptly, this can lower availability... which is bad for business. I wanted to dig in and figure out what was happening.
Normally when I think of unexpected memory growth in a program, I think of leaks. Still, this seemed different. With a leak, you tend to see a more steady, regular, pattern of growth.
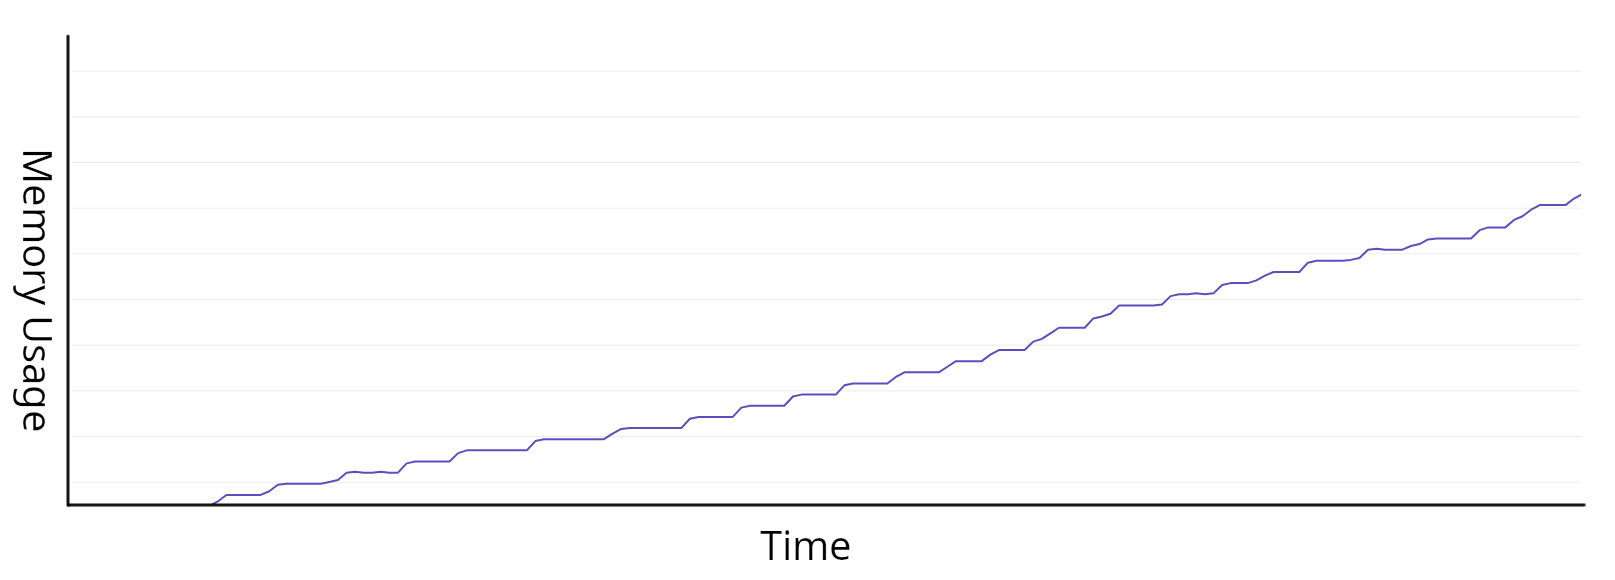
Often this looks like a line sloping up and to the right. So, if our service wasn’t leaking, what was it doing?
If I could identify conditions that caused the jump in memory usage, maybe I could mitigate whatever was happening.
Digging in
I had two burning questions:
- Did something change in our code to promote this behavior?
- Otherwise, did a new traffic pattern emerge?
Looking at historical metrics, I could see similar patterns of sharp increases between long flat periods, but never before did we have this sort of growth. To know if the growth itself was new (in spite of the "stair-step" pattern being normal for us), I’d need a reliable way to reproduce this behavior.
If I could force the "step" to show itself, then I’ll have a way to verify a change in behavior when I take steps to curb the memory growth. I’d also be able to backtrack through our git history and look for a point in time when the service didn’t exhibit seemingly unbounded growth.
The dimensions I used when running my load tests were:
- The size of POST bodies sent to the service.
- The request rate (ie, requests per second).
- The number of concurrent client connections.
The magic combination for me was: larger request bodies and higher concurrency.
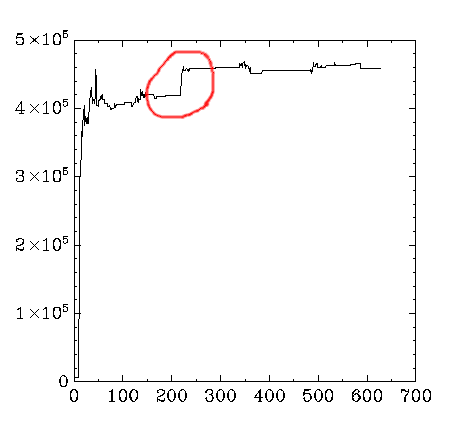
When running load tests on a local system, there are all sorts of limiting factors, including the finite number of processors available for running both clients and the server itself. Still, I was able to see the "stair-step" in the memory on my local machine given just the right circumstances, even at a lower overall request rate.
Using a fixed-sized payload and sending requests in batches, with a brief rest between them, I was able to drive up the memory of the service repeatedly, a step at a time.
I found it interesting that while I could grow the memory over time, I’d eventually hit a point of diminishing returns. Eventually, there’d be some (still much higher than expected) ceiling to the growth. Playing around a little more, I found I could reach an even higher ceiling by sending requests with varying payload sizes.
Once I had identified my input, I was able to work backward through our git history, eventually learning that our production scare was not likely to be the result of recent changes on our end.
The particulars of the workload to trigger this "stair-step" are specific to the application itself, though I was able to force a similar graph to happen with a toy project.
#[derive(serde::Deserialize, Clone)]
struct Widget {
    payload: serde_json::Value,
}

#[derive(serde::Serialize)]
struct WidgetCreateResponse {
    id: String,
    size: usize,
}

async fn create_widget(Json(widget): Json<Widget>) -> Response {
    (
        StatusCode::CREATED,
        Json(process_widget(widget.clone()).await),
    )
        .into_response()
}

async fn process_widget(widget: Widget) -> WidgetCreateResponse {
    let widget_id = uuid::Uuid::new_v4();
    let bytes = serde_json::to_vec(&widget.payload).unwrap_or_default();
    // An arbitrary sleep to pad the handler latency as a stand-in for a more
    // complex code path.
    // Tweak the duration by setting the `SLEEP_MS` env var.
    tokio::time::sleep(std::time::Duration::from_millis(
        std::env::var("SLEEP_MS")
            .as_deref()
            .unwrap_or("150")
            .parse()
            .expect("invalid SLEEP_MS"),
    ))
    .await;
    WidgetCreateResponse {
        id: widget_id.to_string(),
        size: bytes.len(),
    }
}
It turned out that you didn’t need much to get there. I managed to see a similar sharp (but in this case much smaller) increase from an axum app with a single handler receiving a JSON body.
While the memory increases in my toy project were nowhere near as dramatic as we saw in the production service, it was enough to help me compare and contrast during the next phase of my investigation. It also helped me to have the tighter iteration loop of a smaller codebase while I experimented with different workloads. See the README for details on how I ran my load tests.
I spent some time searching the web for bug reports or discussions that might describe a similar behavior. A term that came up repeatedly was Heap Fragmentation and after reading a bit more on the topic, it seemed like it could fit what I was seeing.
What is Heap Fragmentation?
Folks of a certain age may have had the experience of watching a defrag utility on DOS or Windows move blocks around on a hard disk to consolidate the "used" and "free" areas.
In the case of this old PC hard drive, files of varying sizes were written to disk then later moved or deleted, leaving a "hole" of available space between other used regions. As the disk starts to fill up, you might try to create a new file that doesn’t quite fit in one of those smaller areas. In heap fragmentation scenario, that will lead to an allocation failure, though the failure mode of disk fragmentation will be slightly less drastic. On disk, the file will then need to be split to smaller chunks which makes access much less efficient (thanks wongarsu for the correction). The solution for the disk drive is to "defrag" (de-fragment) the drive in order to re-arrange those open blocks co continuous spaces.
Something similar can happen when the allocator (the thing responsible for managing memory allocation in your program) adds and removes values of varying sizes over a period of time. Gaps that are too small and scattered throughout the heap can lead to new "fresh" blocks of memory being allocated to accommodate a new value that won’t fit otherwise. Though unfortunately because of how memory management works a "defrag" is not possible.
The specific cause for the fragmentation could be any number of things: JSON parsing with serde, something at the framework-level in axum, something deeper in tokio, or even just a quirk of the specific allocator implementation for the given system. Even without knowing the root cause (if there is such a thing) the behavior is observable in our environment and somewhat reproducible in a bare-bones app. (Update: more investigation is needed, but we are pretty sure it's the JSON parsing, see our comment on HN)
If this is what was happening to the process memory, what can be done about it? It seems like it would be hard to change the workload to avoid fragmentation. It also seems like it’d be tricky to unwind all the dependencies in my project to possibly find a root cause in the code for how the fragmentation events are occurring. So, what can be done?
Jemalloc to the rescue
jemalloc is self-described as aiming to "[emphasize] fragmentation avoidance and scalable concurrency support." Concurrency was indeed a part of the problem for my program, and avoiding fragmentation is the name of the game. jemalloc sounds like it could be just what I need.
Since jemalloc is an allocator that goes out of its way to avoid fragmentation in the first place, the hope was our service might be able to run longer without gradually increasing the memory.
It’s not so trivial to change the inputs to my program, or the pile of application dependencies. It is, however, trivial to swap out the allocator. Following the examples in the https://github.com/tikv/jemallocator readme, very little work was required to take it for a test drive.
For my toy project, I added a cargo feature to optionally swap out the default allocator for jemalloc and re-ran my load tests.
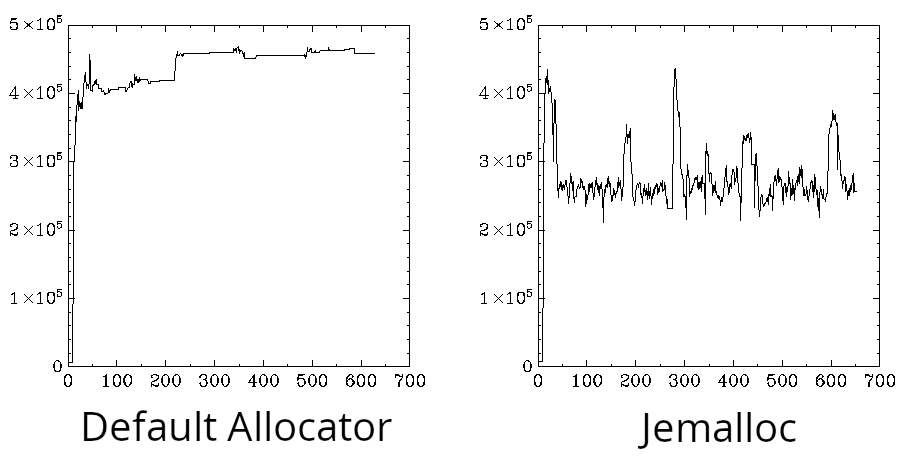
Recording the resident memory during my simulated load shows the two distinct memory profiles.
Without jemalloc, we see the familiar stair-step profile. With jemalloc, we see the memory rise and fall repeatedly as the test runs. More importantly, while there is a considerable difference between the memory usage with jemalloc during load versus idle times, we don’t "lose ground" as we did before since the memory always comes back down to the baseline.
Wrapping Up
If you happen to see a "stair-step" profile on a Rust service, consider taking jemalloc for a test drive. If you happen to have a workload that promotes heap fragmentation, jemalloc may give a better result overall.
Separately, included in the toy project repo is a benchmark.yml for use with the https://github.com/fcsonline/drill load testing tool. Try changing the concurrency, body size (and the arbitrary handler sleep duration in the service itself), etc to see how the change in allocator impacts the memory profile.
As for real-world impact, you can clearly see the profile change when we rolled out the switch to jemalloc.
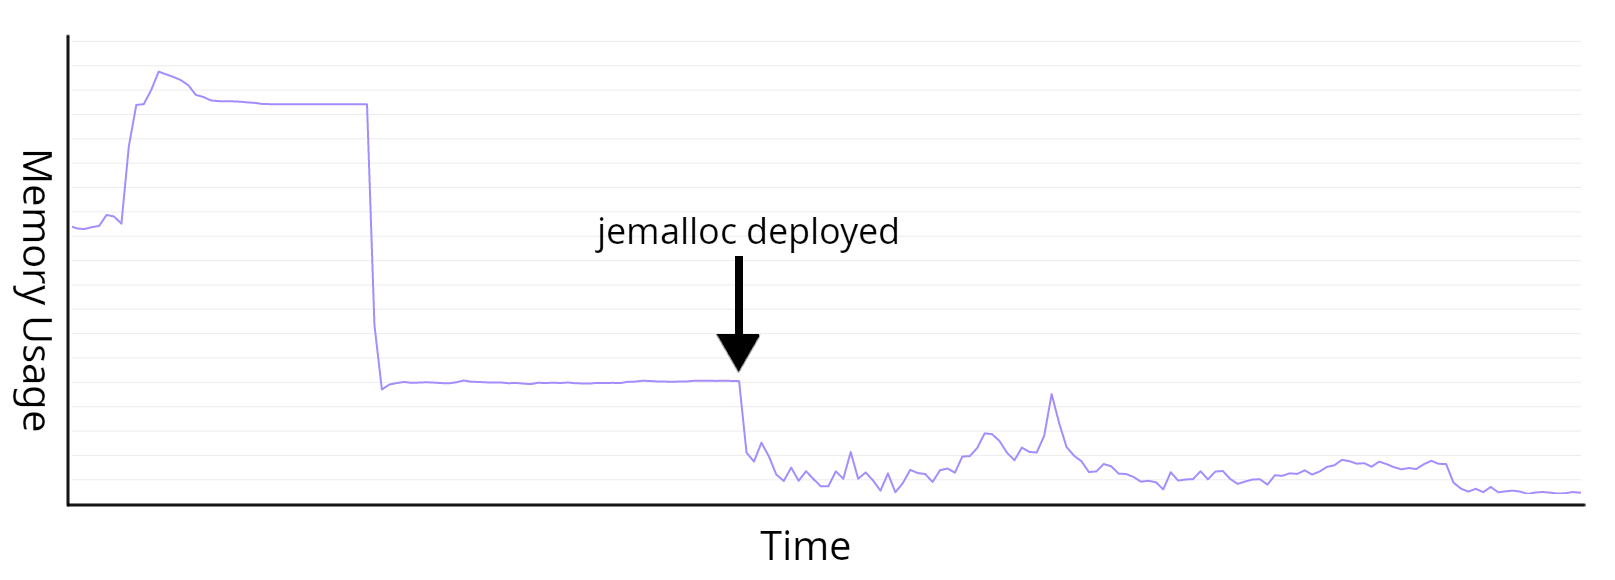
Where the service used to show flat lines and large steps, often regardless of load, we now see a more ragged line that follows the active workload more closely. Aside from the benefit of helping the service avoid needless memory growth, this change gave us better insight into how our service responds to load so all in all, this was a positive outcome.
If you're interested in building a robust and scalable service using Rust, we are hiring! Check out our careers page for more information.
For more content like this, make sure to follow us on Twitter, Mastodon, Github or RSS for the latest updates for the Svix webhook service, or join the discussion on our community Slack.